
More and more Azure services are getting support for OpenTelemetry. Today I’ll have a look at how VM Insights can capture and display metrics in the opentelemetry format.
What is OpenTelemetry
OpenTelemetry is an observability framework and toolkit designed to facilitate the generation, export and collection of telemetry data such as traces, metrics and logs.
The OpenTelemetry defines a semantic convention (semantic attributes) for system metrics that is OS independent. This means Windows and Linux performance counters are converted into a consistent naming convention and metric data model.
What is VM Insights
VM insights is a set of predefined workbooks (read dashboards) that allows you to quick and easily get started with monitoring the performance trends of your VMs.
The classic version of VM insights (v1) uses a Log Analytics workspace to store and visualize your VM performance data. With OpenTelemetry (OTel) for VM insights (v2) the system metrics is stored in an Azure Monitor workspace. Metrics stored here are cheaper and faster to query than when stored in Log Analytics workspace.
By using the new OTel metrics you get cross-platform consistency with a unified schema across linux and windows VMs, standard system-level metrics and per-process metrics. All in a solution where the default core set of metrics collected by VM insights v2 have no cost!
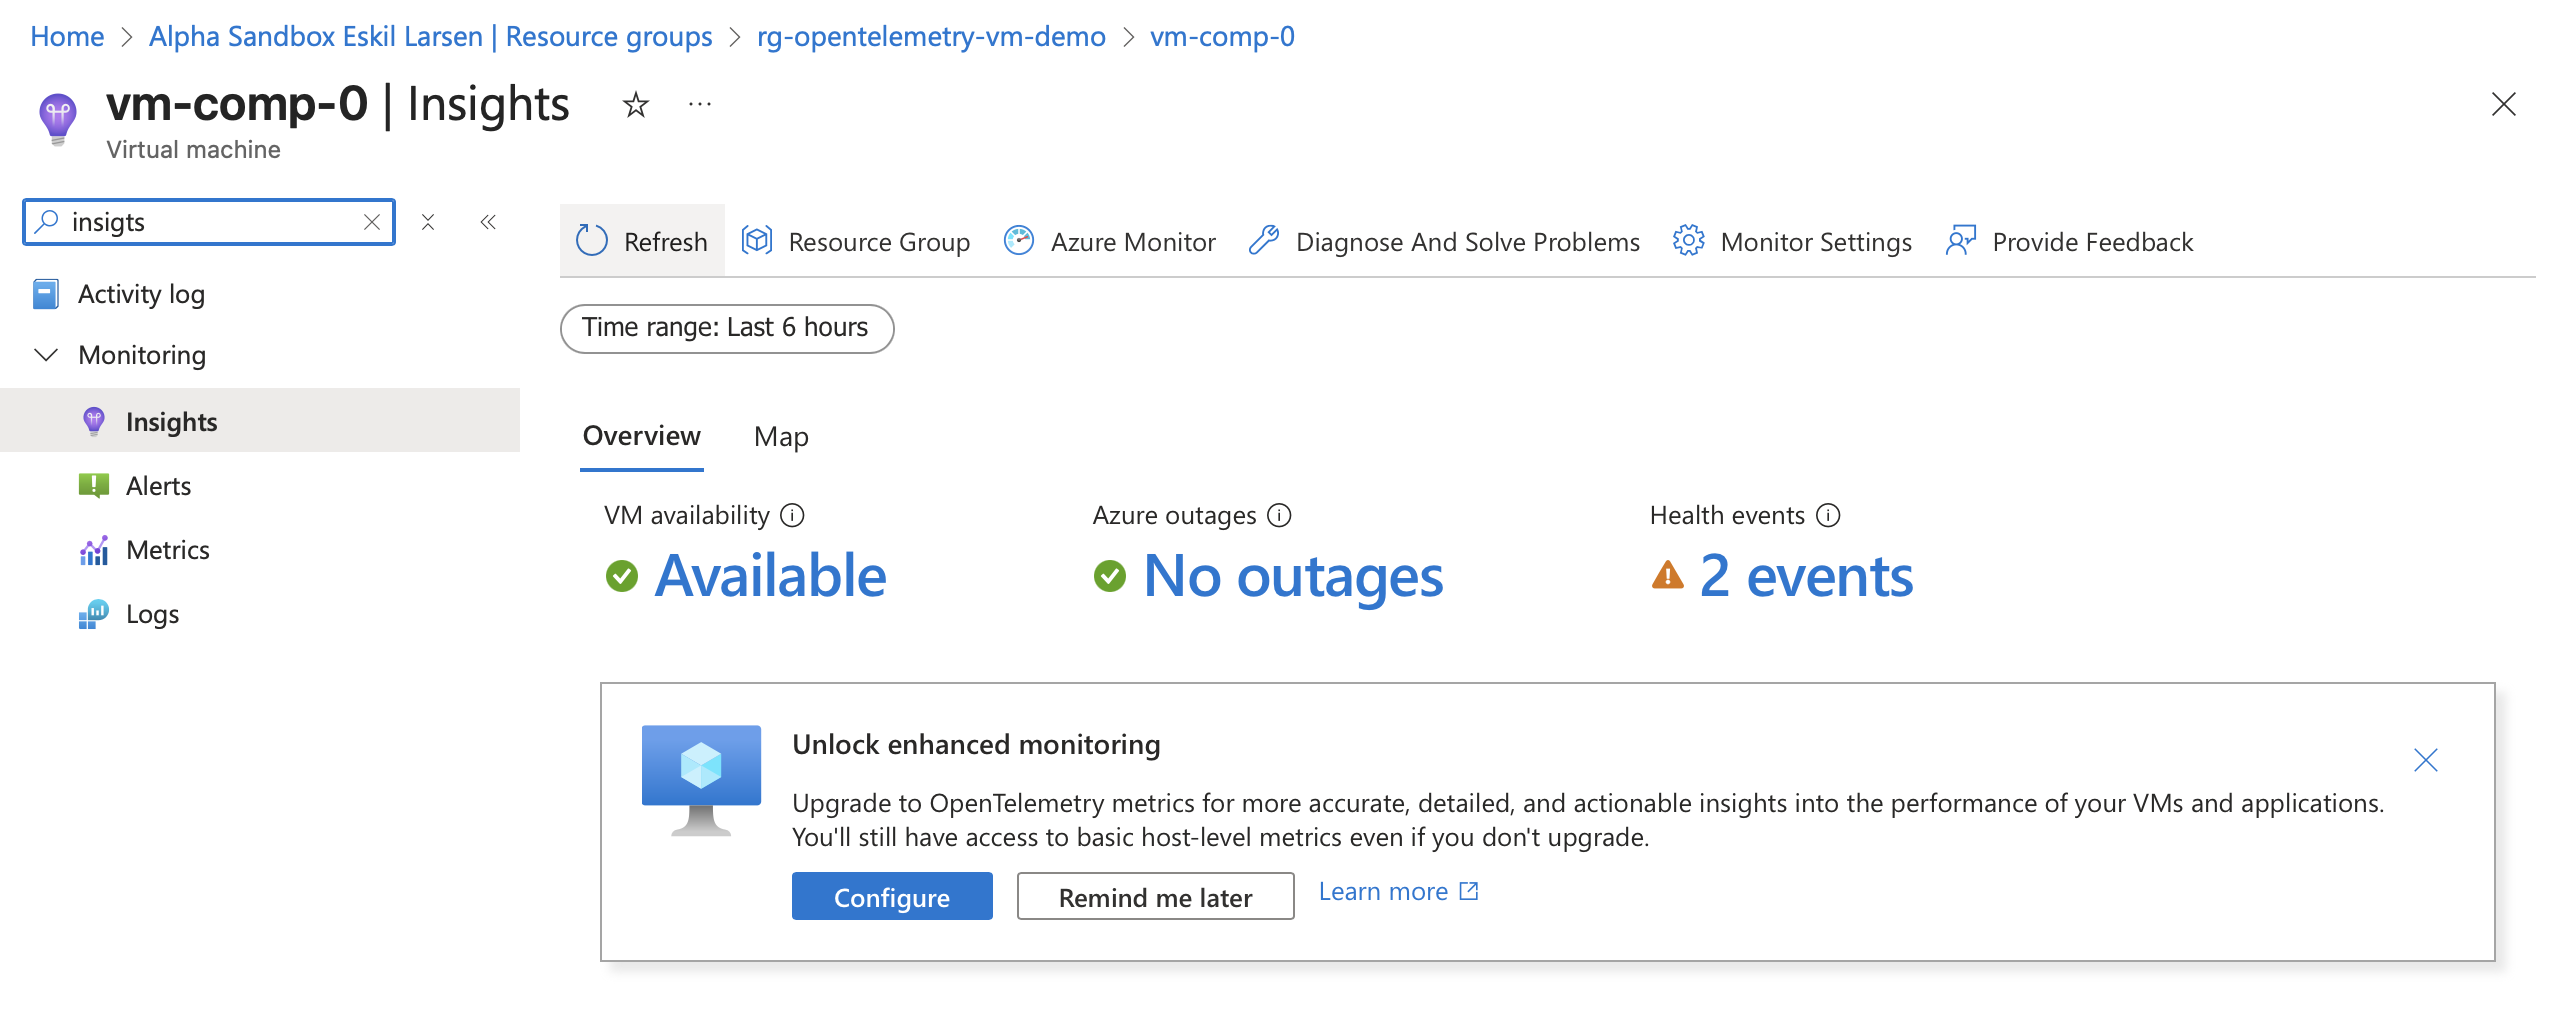
Onboarding a new VM
Heading over to the Insights blade on a fresh VM shows a “Upgrade to OpenTelemetry metrics…” button. Lets start with the configure option.
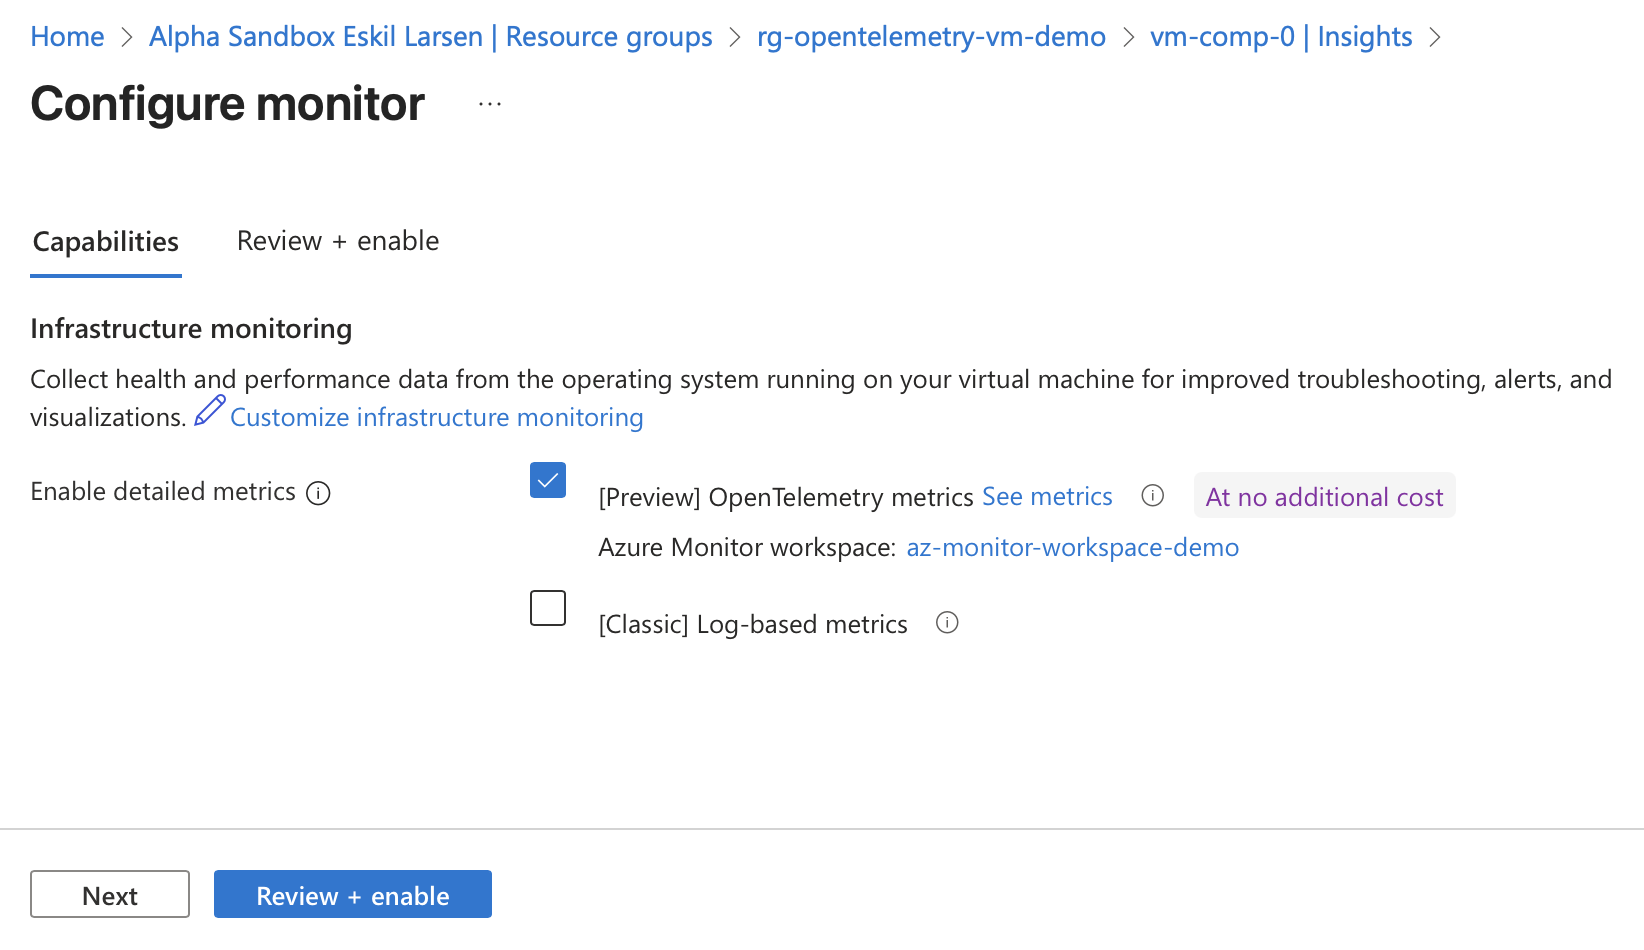
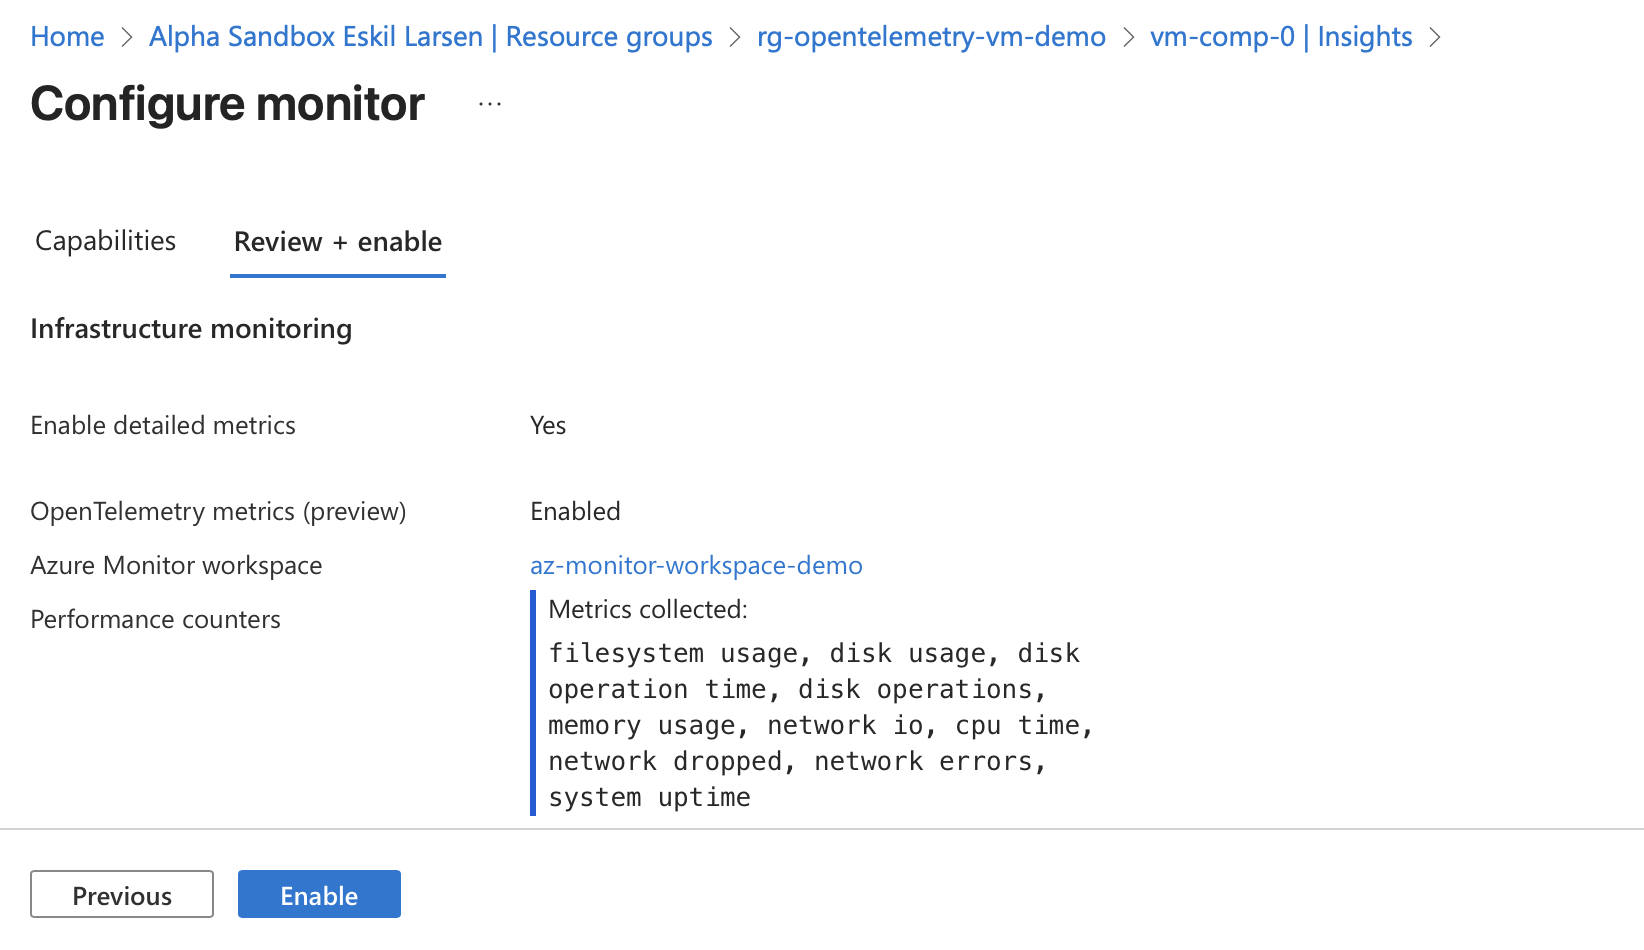
It is possible to have both Log-based metrics and OpenTelemetry metrics, or just one of them. For the OpenTelemetry option I can select my desired performance metrics and an Azure Monitor Workspace as the destination for the metrics. I go with the default performance metrics.
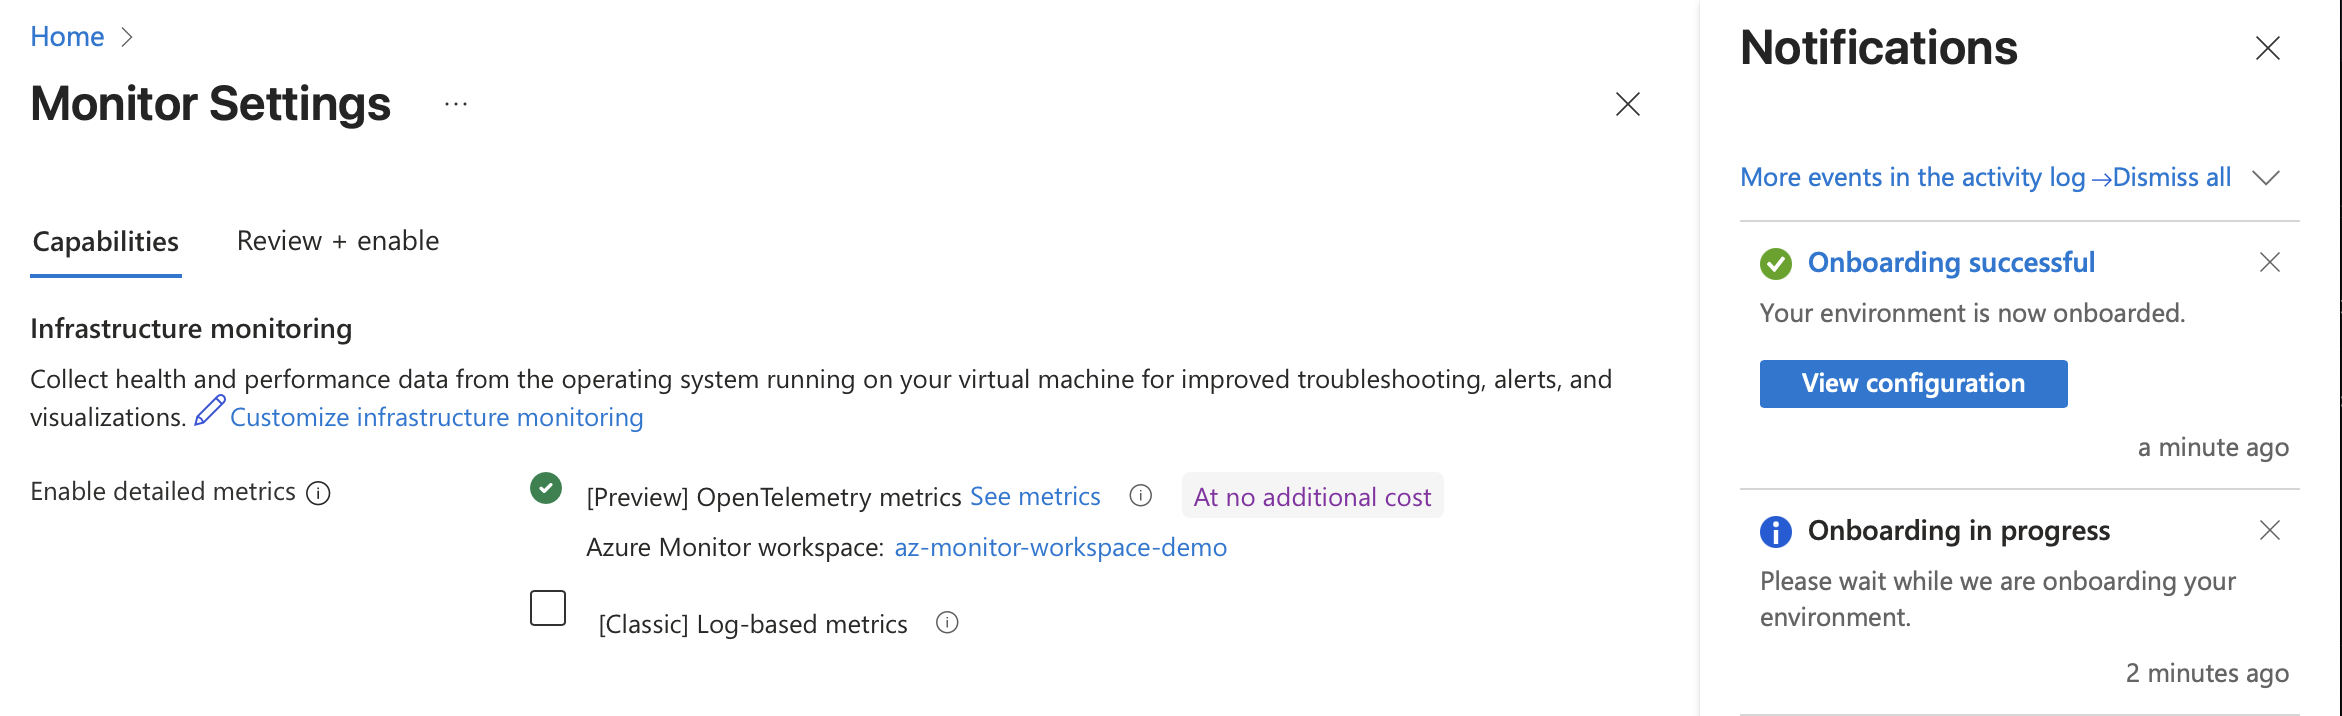
Selecting Enable starts the onboarding process…
Once it is complete, click View configuration, and now it shows a green checkmark by the OpenTelemetry option, indicating it is already enabled.
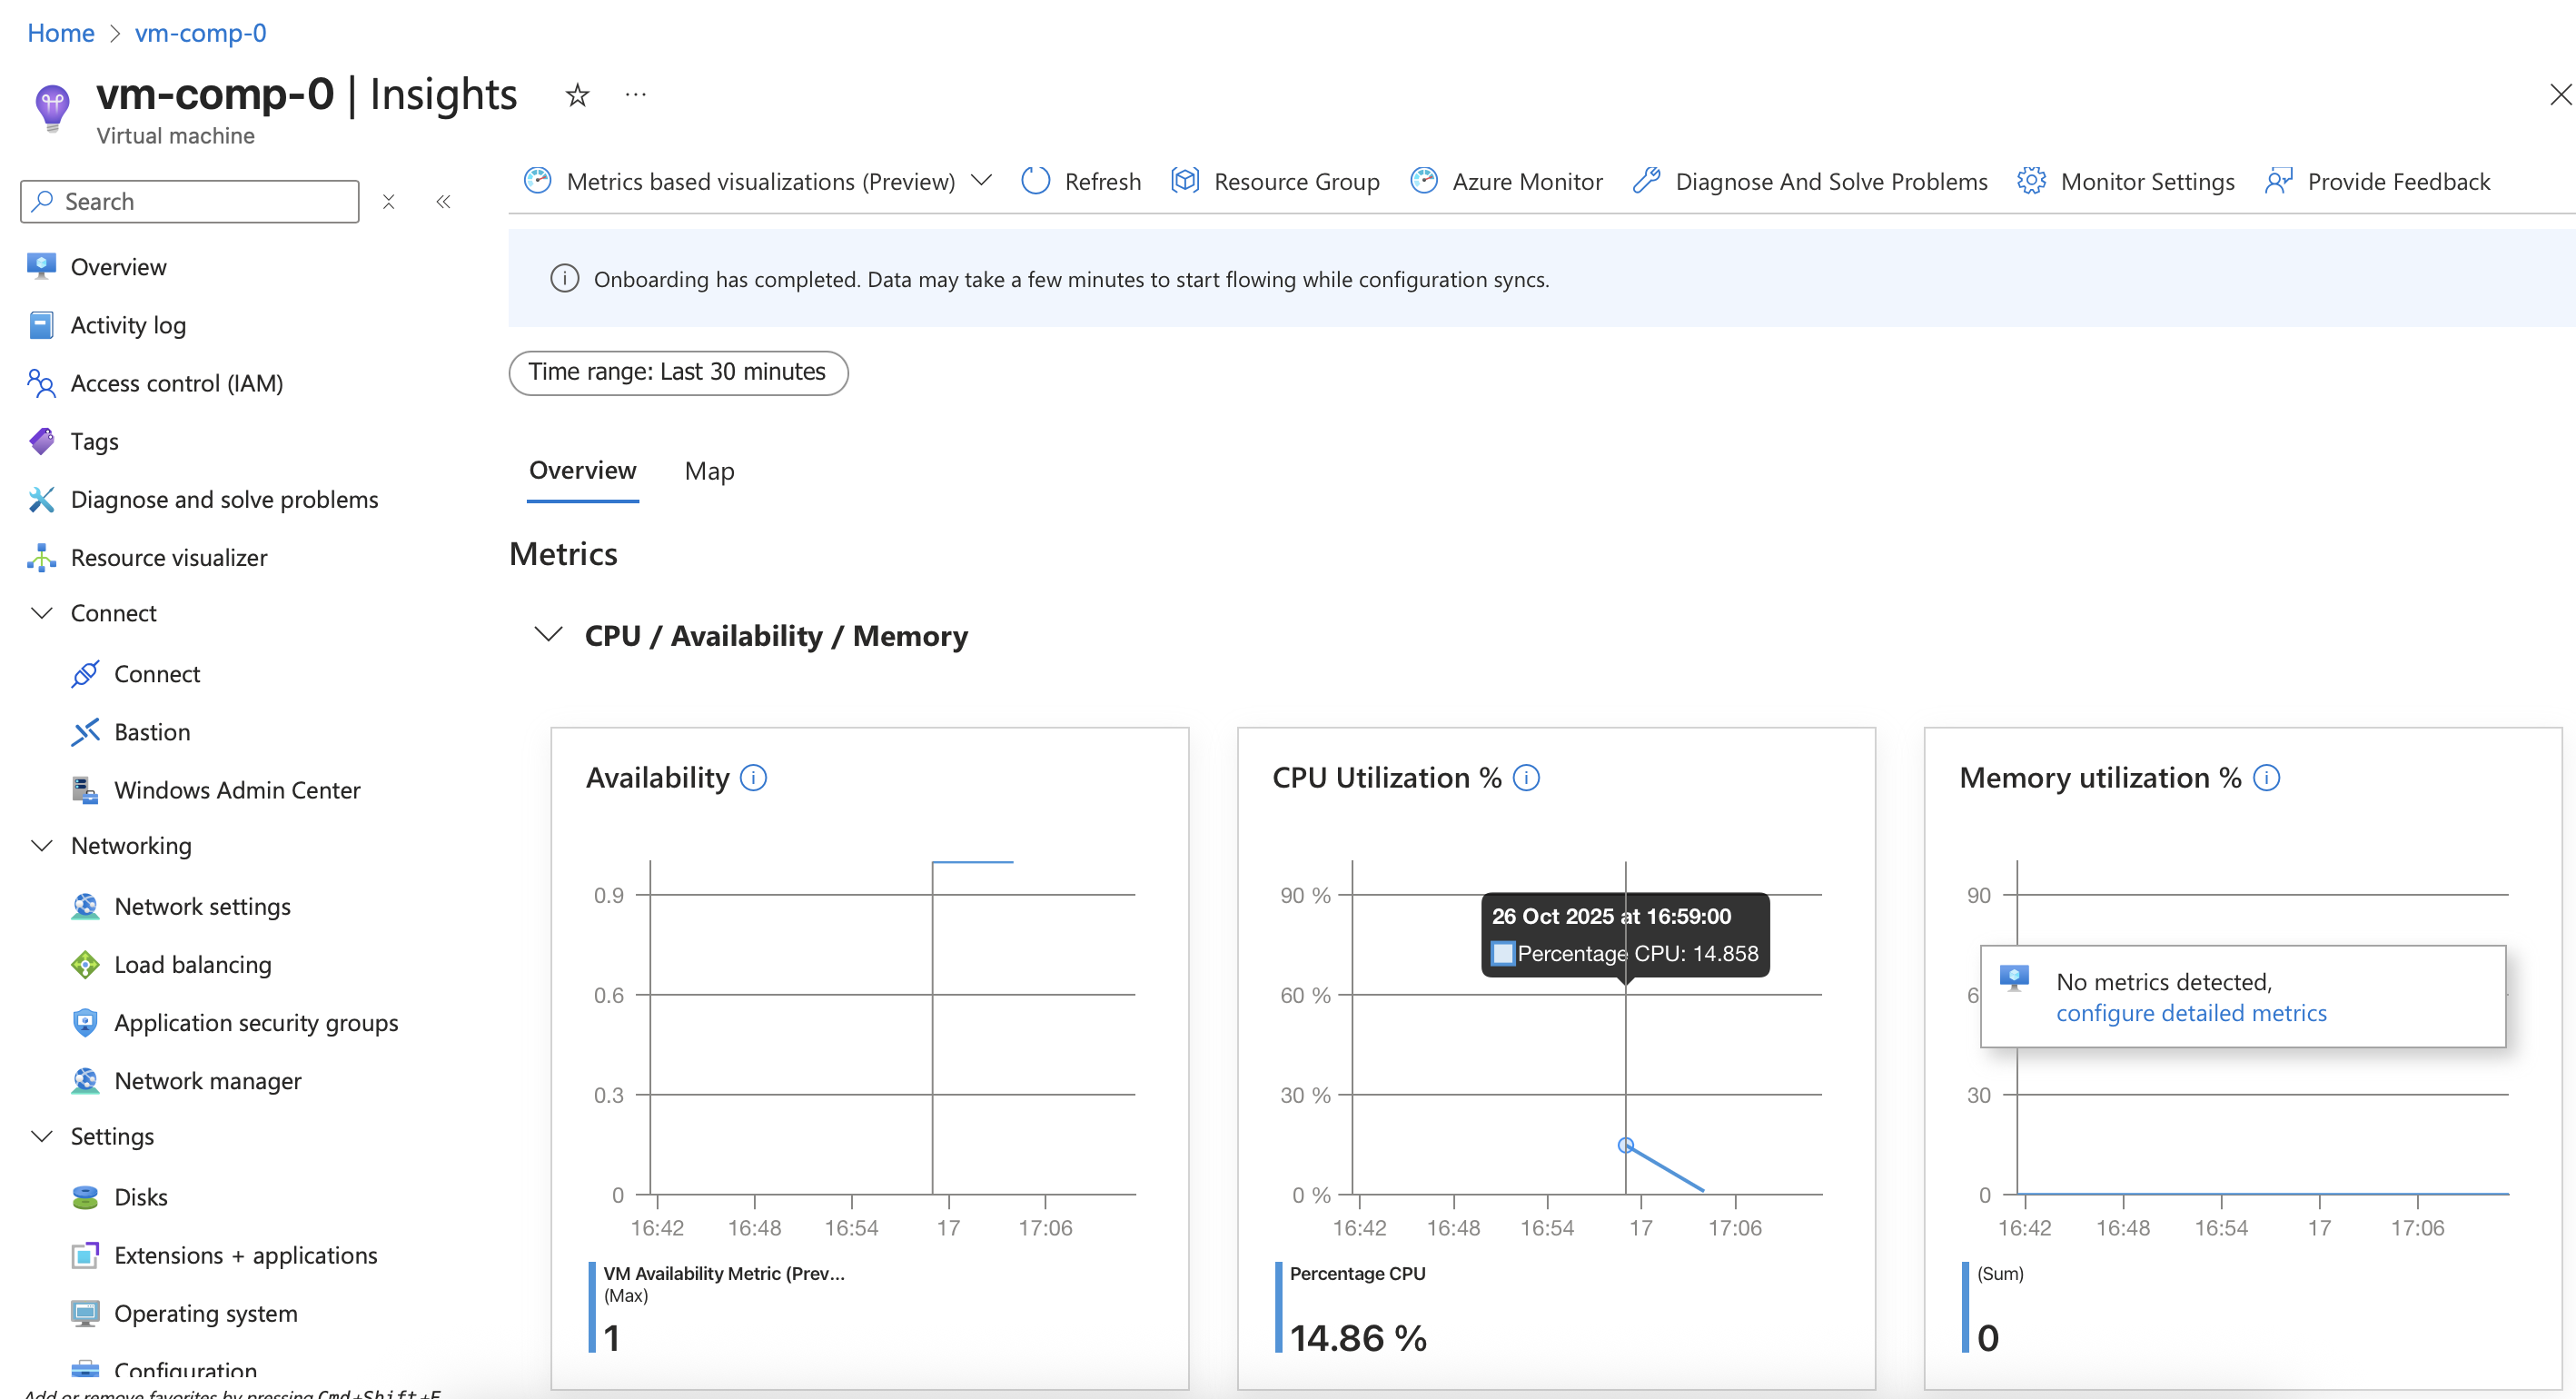
Heading back to the VM Insights there is now a message at the top: “Onboarding has completed. Data may take a few minutes to start flowing while configuration syncs”, but there is already some CPU metrics being populated!
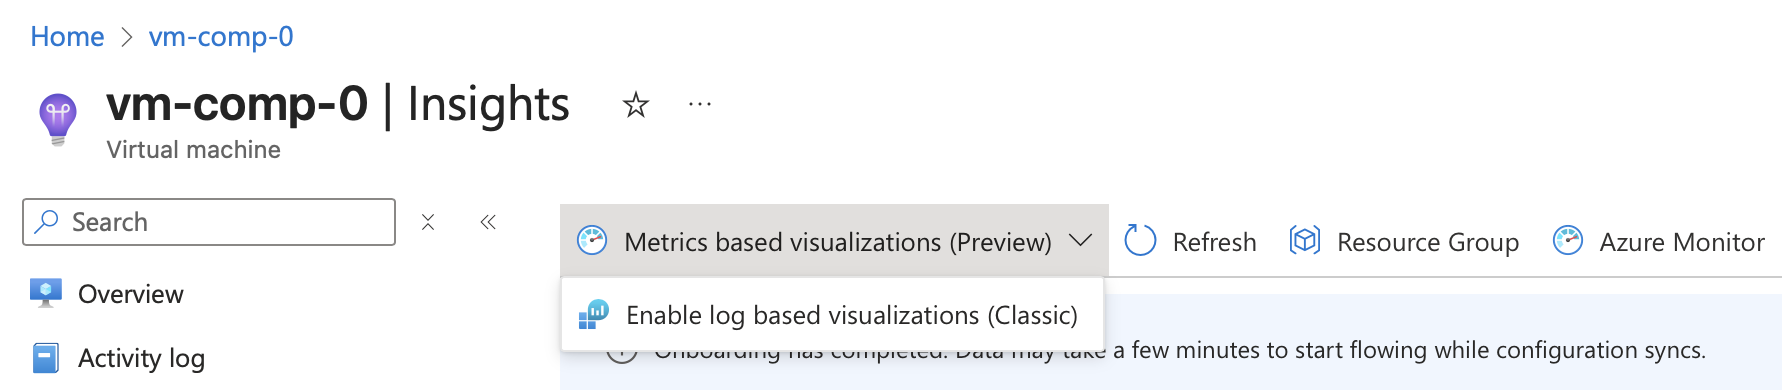
At the top of the Insights page there is a dropdown menu to switch the view between the classic log-based metrics and the OpenTelemetry-based metrics.
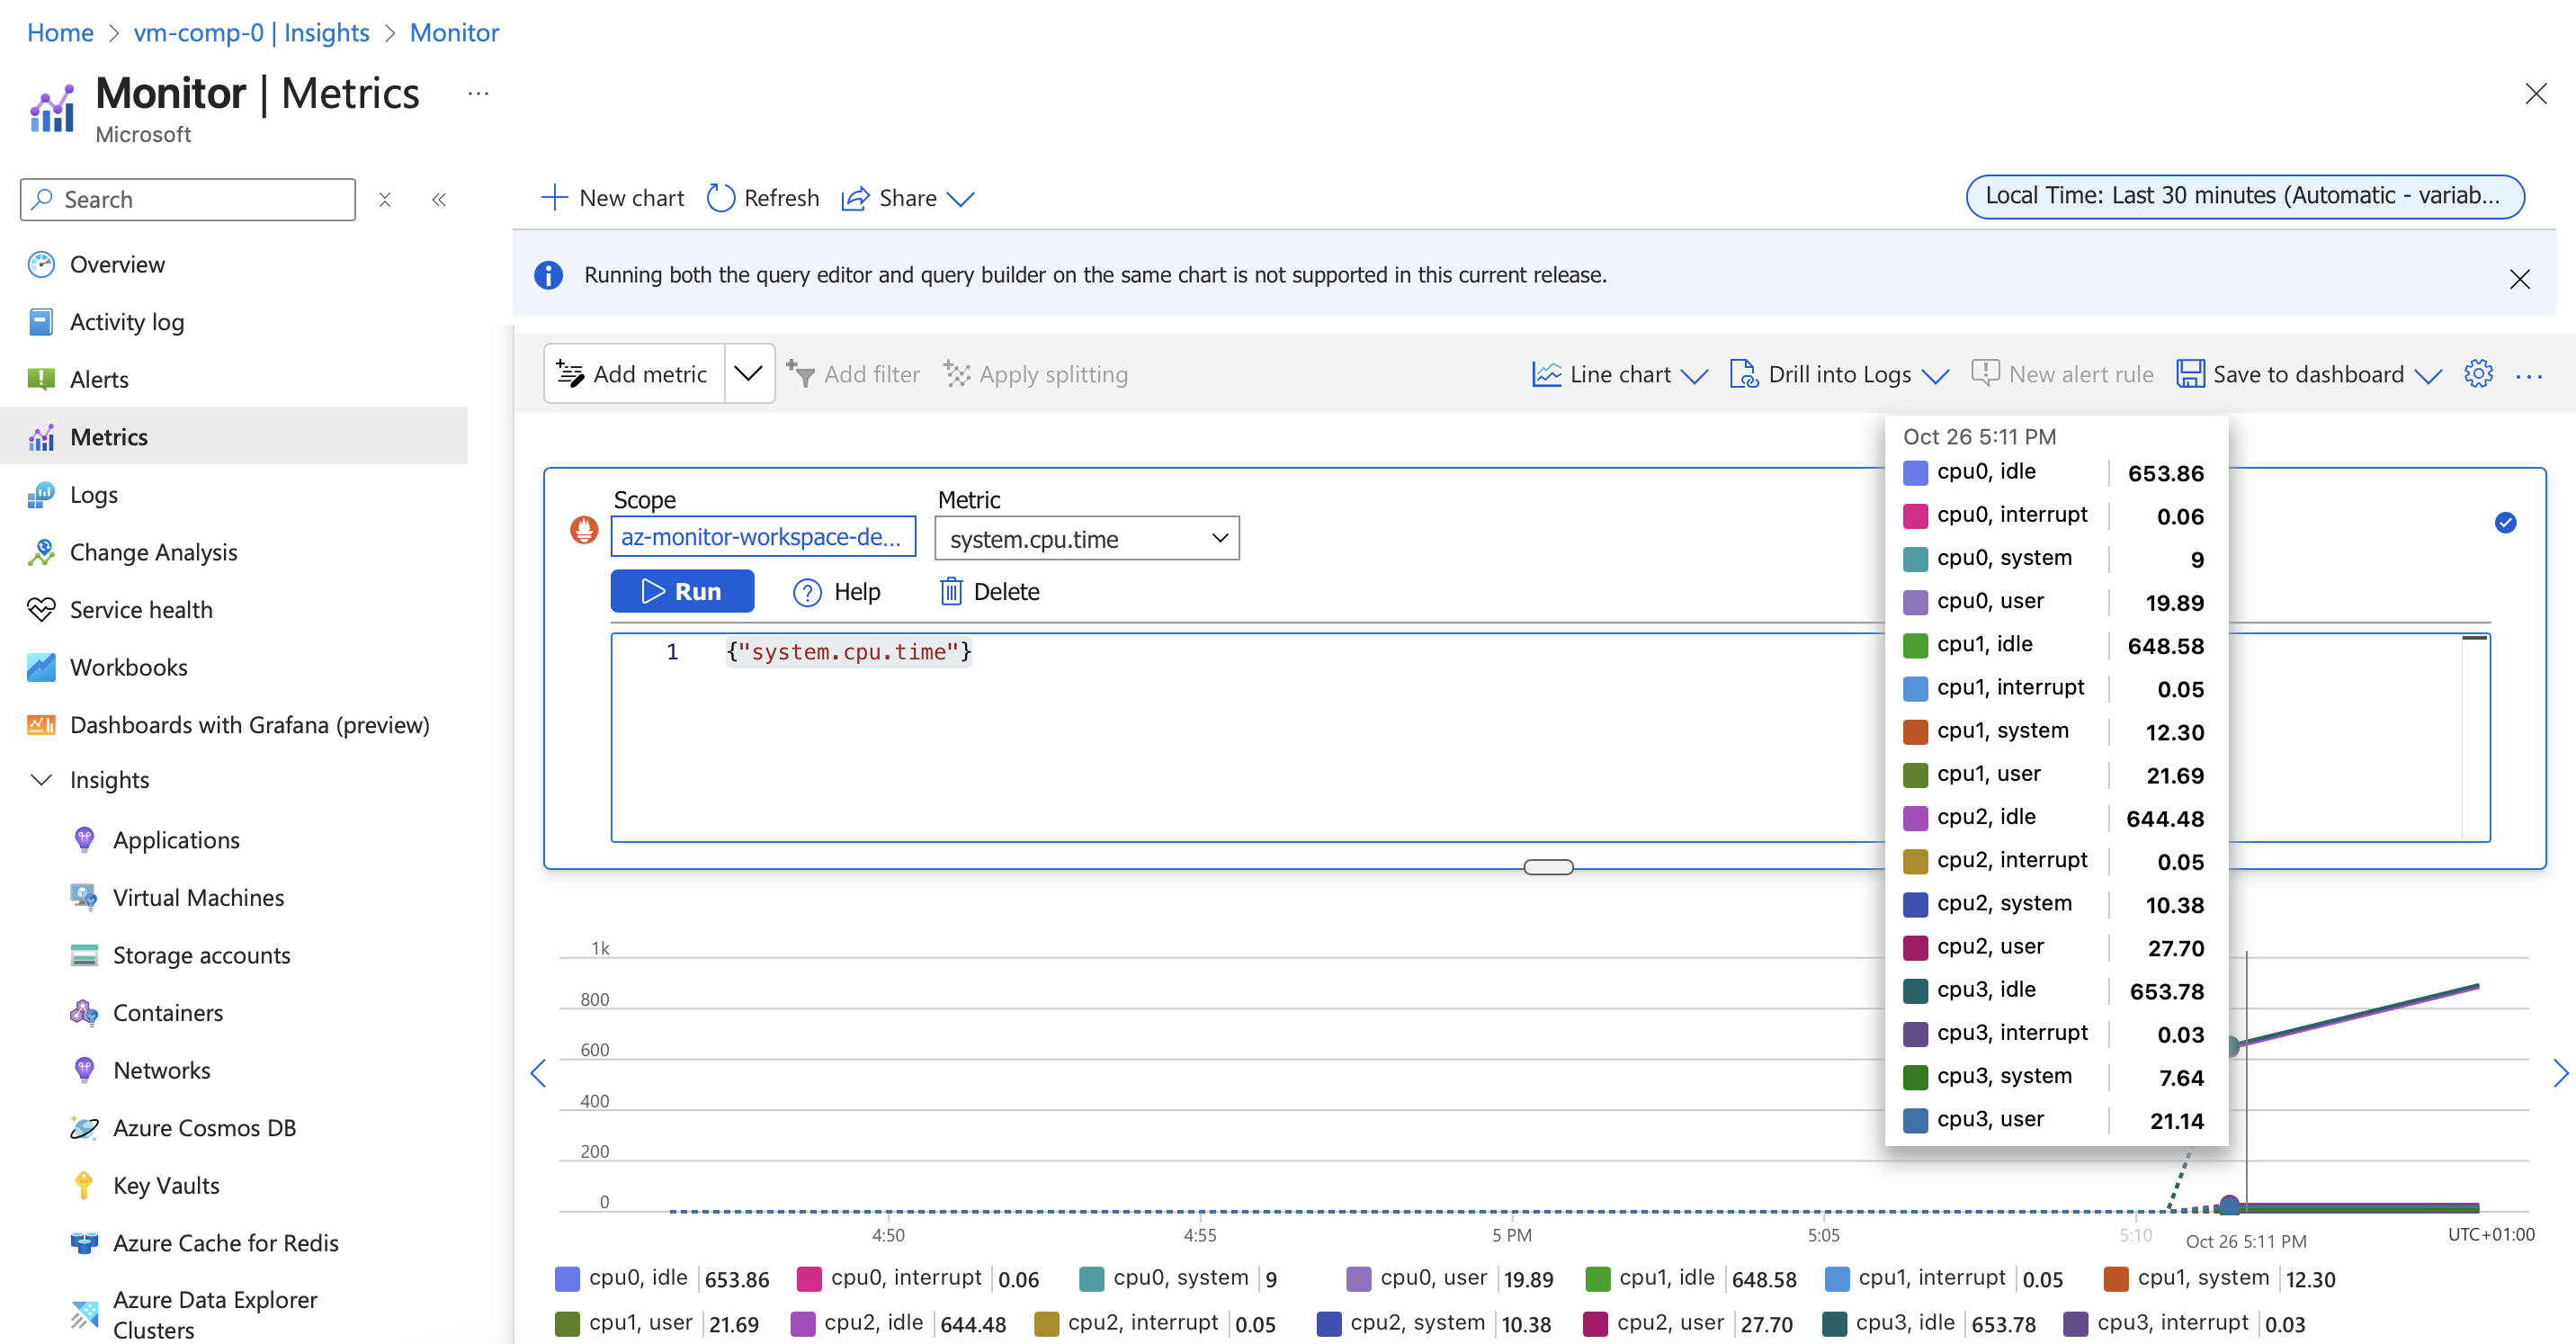
Query with PromQL
In azure monitor, set the scope to be the azure monitor workspace and build a PromQL query to visualize some metrics.
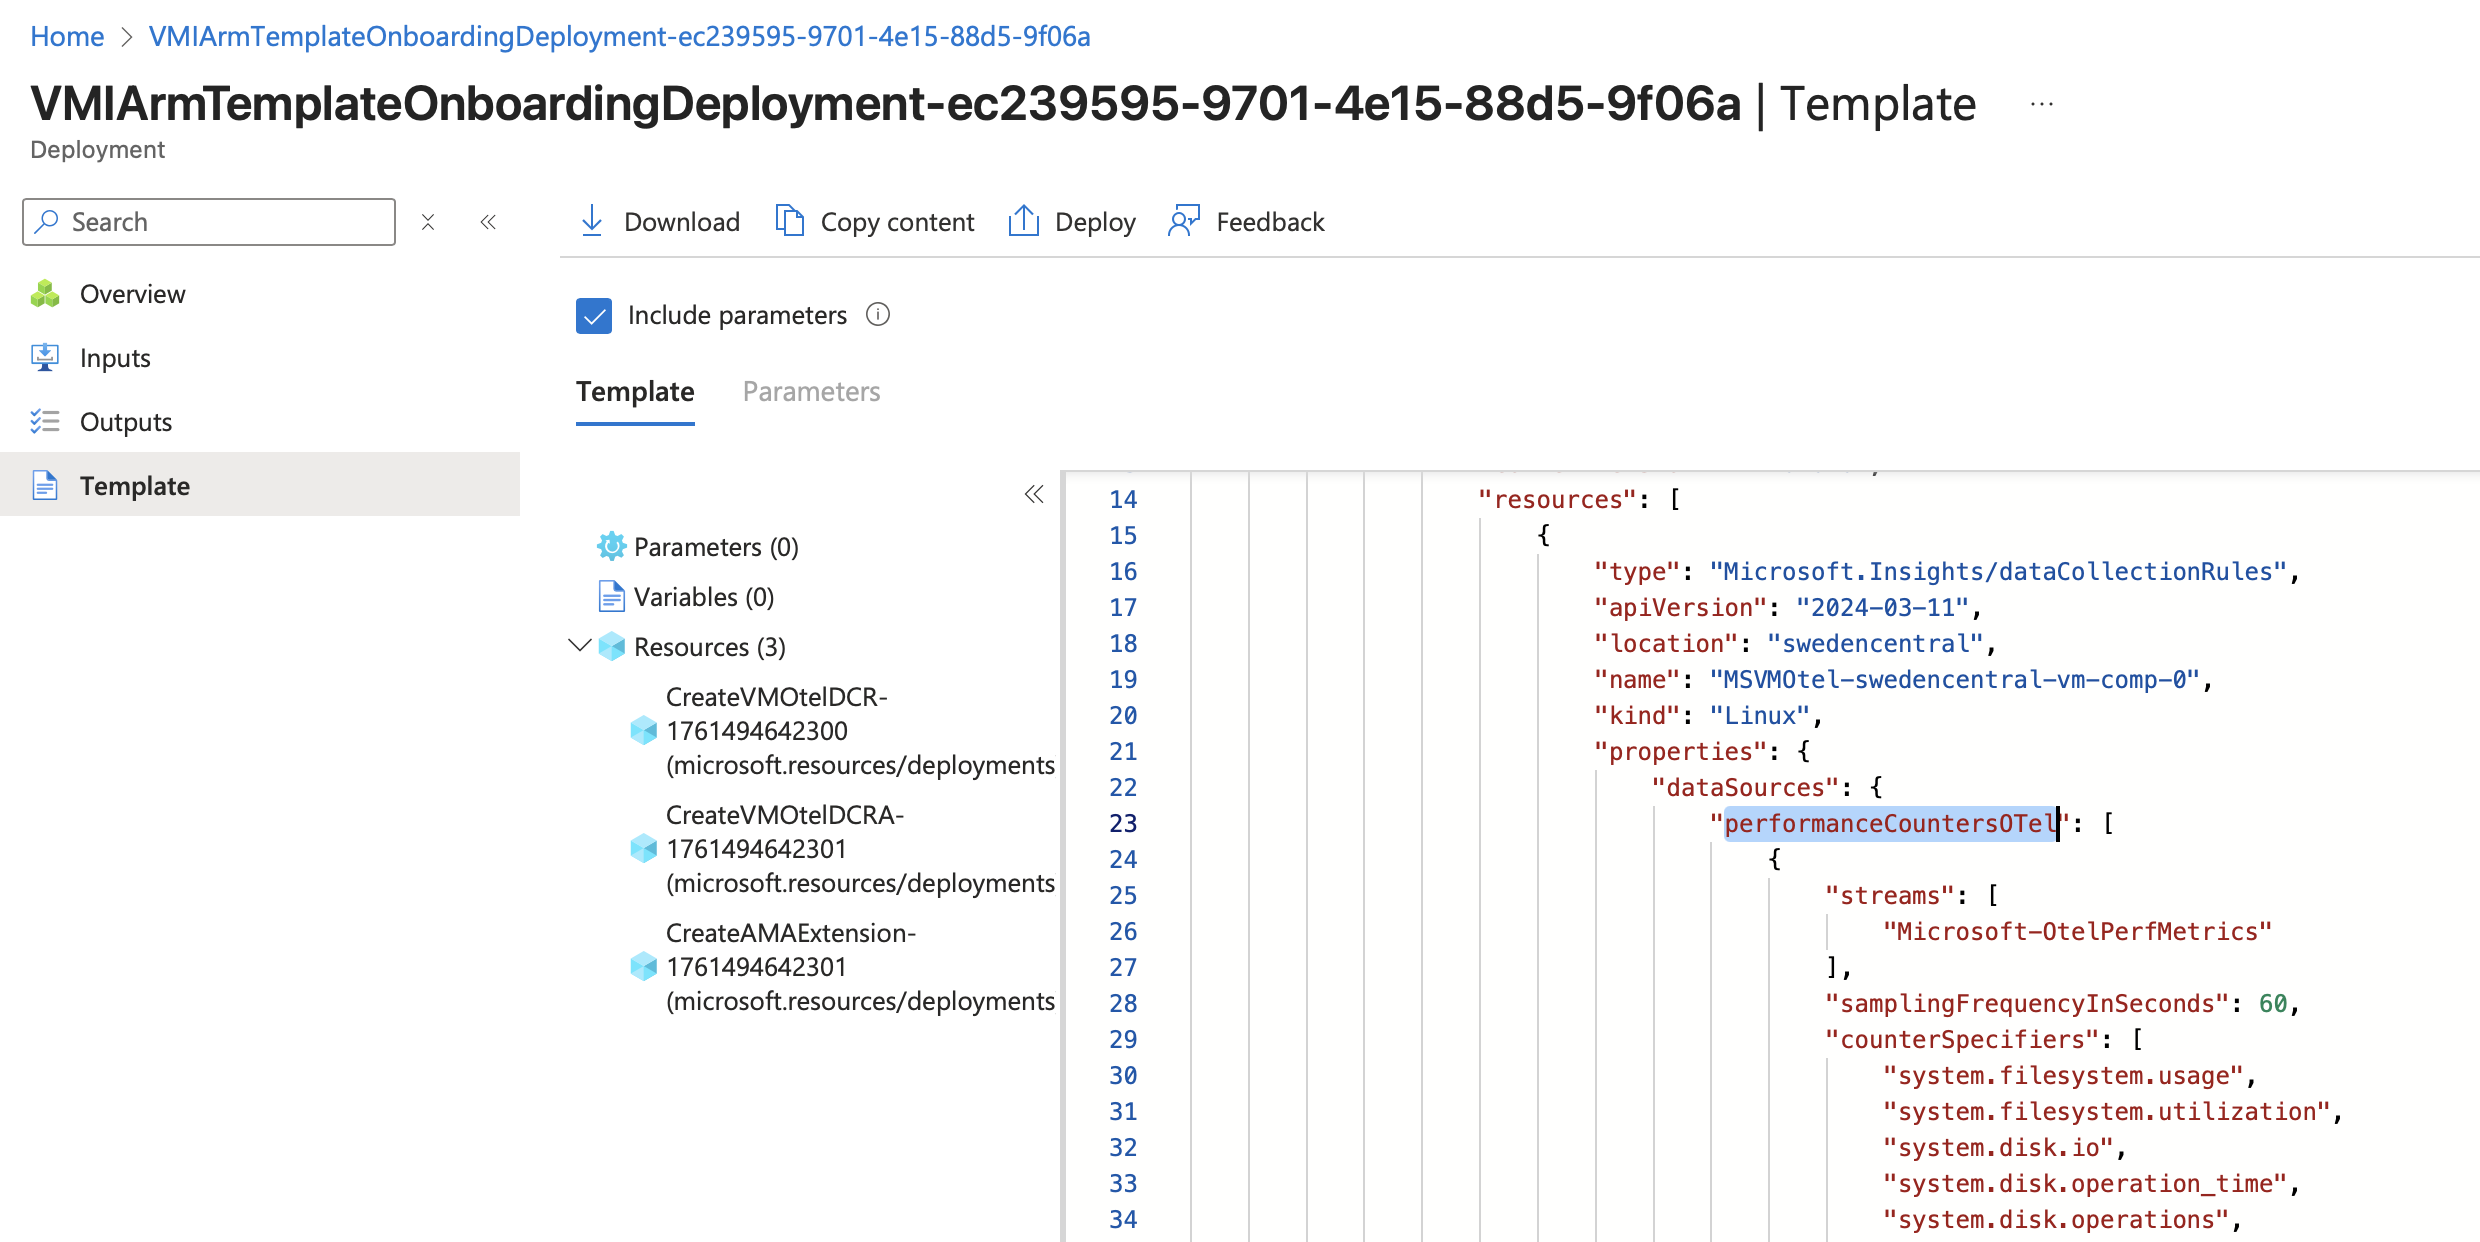
Onboarding as code
Going back and having a look at the ARM deployment from the onboarding phase shows how this could all been deployed as code.
Full example with bicep
Below is a full exmaple deployment with all resources needed for a quick demo. Click any filename to expand.
main.bicep
targetScope = 'subscription'

param location string
param vmResourceGroupName string
param dcrResourceGroupName string
param virtualNetworkConfiguration {
  name: string
  addressPrefixes: array
  subnet1: { name: string, addressPrefix: string }
}
param vmName string
@secure()
param vmAdminPassword string = '1notSecureDemo420!'
param vmAdminUsername string
param uamiName string
param dataCollectionRuleName string
param azureMonitorWorkspaceConfiguration {
  name: string
  publicNetworkAccess: 'Enabled' | 'Disabled'
}

resource rgVm 'Microsoft.Resources/resourceGroups@2025-04-01' existing = {
  name: vmResourceGroupName
  dependsOn: [rg_module_vm]
}

resource rgDcr 'Microsoft.Resources/resourceGroups@2025-04-01' existing = {
  name: dcrResourceGroupName
  dependsOn: [rg_module_dcr]
}

module rg_module_vm 'br/public:avm/res/resources/resource-group:0.4.2' = {
  params: {
    name: vmResourceGroupName
    location: location
  }
}

module rg_module_dcr 'br/public:avm/res/resources/resource-group:0.4.2' = {
  params: {
    name: dcrResourceGroupName
    location: location
  }
}

module nsg 'br/public:avm/res/network/network-security-group:0.5.2' = {
  scope: rgVm
  params: {
    name: '${virtualNetworkConfiguration.name}-${virtualNetworkConfiguration.subnet1.name}-nsg'
  }
}

module vnet 'br/public:avm/res/network/virtual-network:0.7.1' = {
  scope: rgVm
  params: {
    name: virtualNetworkConfiguration.name
    addressPrefixes: virtualNetworkConfiguration.addressPrefixes
  }
}

module subnet 'br/public:avm/res/network/virtual-network/subnet:0.1.3' = {
  scope: rgVm
  params: {
    name: virtualNetworkConfiguration.subnet1.name
    virtualNetworkName: vnet.outputs.name
    addressPrefixes: [virtualNetworkConfiguration.subnet1.addressPrefix]
    networkSecurityGroupResourceId: nsg.outputs.resourceId
  }
}

module bastion 'br/public:avm/res/network/bastion-host:0.8.0' = {
  scope: rgVm
  params: {
    name: 'bastion-host'
    virtualNetworkResourceId: vnet.outputs.resourceId
    skuName: 'Developer'

  }
}

module uami 'br/public:avm/res/managed-identity/user-assigned-identity:0.4.2' = {
  scope: rgVm
  params: {
    name: uamiName
  }
}

module virtualMachine 'br/public:avm/res/compute/virtual-machine:0.20.0' = {
  scope: rgVm
  params: {
    name: vmName
    adminUsername: vmAdminUsername
    adminPassword: vmAdminPassword
    availabilityZone: -1
    imageReference: {
      publisher: 'Canonical', offer: '0001-com-ubuntu-server-jammy', sku: '22_04-lts-gen2', version: 'latest'
    }
    nicConfigurations: [
      {
        ipConfigurations: [{ name: 'ipconfig01', subnetResourceId: subnet.outputs.resourceId }]
        nicSuffix: '-nic-01'
      }
    ]
    osDisk: {
      caching: 'ReadWrite'
      diskSizeGB: 128
      managedDisk: { storageAccountType: 'Premium_LRS' }
    }
    osType: 'Linux'
    vmSize: 'Standard_D2as_v4'
    managedIdentities: { userAssignedResourceIds: [uami.outputs.resourceId] }
  }
}

module amaExtension '.bicep/azure-monitor-agent-ext/main.bicep' = {
  scope: rgVm
  params: {
    location: rgVm.location
    vmName: virtualMachine.outputs.name
    vmOsType: 'Linux'
    uamiIdentifier: {
      type: 'mi_res_id'
      value: uami.outputs.resourceId
    }
  }
}

module azureMonitorWorkspace '.bicep/azure-monitor-workspace/main.bicep' = {
  scope: rgDcr
  params: {
    name: azureMonitorWorkspaceConfiguration.name
    publicNetworkAccess: azureMonitorWorkspaceConfiguration.publicNetworkAccess
  }
}

// avm module uses an older api version of the dcr resource without support for dataSources performanceCountersOTel
// module dcr_opentelemetry 'br/public:avm/res/insights/data-collection-rule:0.8.0' = {
module dcr_opentelemetry '.bicep/data-collection-rule/main.bicep' = {
  scope: rgDcr
  params: {
    name: dataCollectionRuleName
    kind: 'Linux'
    dataFlows: [
        {
          streams: ['Microsoft-OtelPerfMetrics']
          destinations: ['MonitoringAccountDestination']
        }
      ]
    dataSources: {
      performanceCountersOTel: [{
        name: 'OtelDataSource'
        streams: ['Microsoft-OtelPerfMetrics']
        samplingFrequencyInSeconds: 60
        counterSpecifiers: [
          'system.filesystem.usage'
          'system.filesystem.utilization'
          'system.disk.io'
          'system.disk.operation_time'
          'system.disk.operations'
          'system.memory.usage'
          'system.network.io'
          'system.cpu.time'
          'system.uptime'
          'system.network.dropped'
          'system.network.errors'
        ]
      }]
    }
    destinations: {
      monitoringAccounts: [{ name: 'MonitoringAccountDestination', accountResourceId: azureMonitorWorkspace.outputs.resourceId }]
    }
  }
}

module dcr_association '.bicep/data-collection-rule-association/main.bicep' = {
  scope: rgVm
  params: {
    dataCollectionRuleId: dcr_opentelemetry.outputs.resourceId
    virtualMachineName: virtualMachine.outputs.name
  }
}
.bicep/azure-monitor-agent-ext/main.bicep
param vmName string
param vmOsType 'Linux' | 'Windows'
param location string

@description('Optional. User assigned managed identity to use with Azure Monitor Agent.')
param uamiIdentifier {
  type: 'mi_res_id' | 'object_id' | 'client_id'
  value: string
}?

resource ext 'microsoft.compute/virtualmachines/extensions@2022-11-01' = {
  name: '${vmName}/AzureMonitorAgent'
  location: location
  properties: {
    publisher: 'Microsoft.Azure.Monitor'
    type: vmOsType == 'Windows' ? 'AzureMonitorWindowsAgent' : 'AzureMonitorLinuxAgent'
    enableAutomaticUpgrade: false
    autoUpgradeMinorVersion: true
    typeHandlerVersion: vmOsType == 'Windows' ? '1.22' : '1.29'
    settings: {
      ...(!empty(uamiIdentifier) ? {
        authentication: {
          managedIdentity: {
            'identifier-name': uamiIdentifier!.type
            'identifier-value': uamiIdentifier!.value
          }
        }
      } : {})
    }
  }
}
.bicep/azure-monitor-workspace/main.bicep
param name string
param publicNetworkAccess 'Enabled' | 'Disabled'

resource monitorWorkspace 'Microsoft.Monitor/accounts@2025-05-03-preview' = {
  location: resourceGroup().location
  name: name
  properties: {
    publicNetworkAccess: publicNetworkAccess
  }
}

output resourceId string = monitorWorkspace.id
.bicep/data-collection-rule/main.bicep
param name string
param kind 'Linux' | 'Windows' | 'All'
param dataSources { performanceCountersOTel: object[] }
param destinations { monitoringAccounts: { name: string, accountResourceId: string }[] }
param dataFlows { streams: string[], destinations: string[] }[]

resource dcr 'Microsoft.Insights/dataCollectionRules@2024-03-11' = {
  name: name
  location: resourceGroup().location
  kind: kind
  properties: {
    dataSources: dataSources
    destinations: destinations
    dataFlows: dataFlows
  }
}

output resourceId string = dcr.id
.bicep/data-collection-rule-association/main.bicep
metadata info = 'targetScope must be the resource group of the VM'

param dataCollectionRuleId string
param virtualMachineName string

resource existingVm 'Microsoft.Compute/virtualMachines@2025-04-01' existing = {
  name: virtualMachineName
}

resource dcrAssociation 'Microsoft.Insights/dataCollectionRuleAssociations@2023-03-11' = {
  name: 'VirtualMachineInsightsMetricsExtension'
  scope: existingVm
  properties: {
    dataCollectionRuleId: dataCollectionRuleId
  }
}